|
Information
Results
Resources
Our partners
|
|
|
Highlights
We present the next release of a combined measurement and modeling system that keeps track of the emissions ("sources") and removal ("sinks") of atmospheric CO2 globally from January 2001 through December 2017. CarbonTracker Europe 2018 (released on 15 October 2018) incorporates several innovations compared to earlier systems, and provides a new view on the global carbon cycle.
- We have added new observations, where available on hourly time resolution, using the ObsPack products GLOBALVIEWplusv3.2 and NRTv4.2.
- We have used SiBCASA-GFED as the prior biosphere model on a 3-hourly time resolution. Prior to 2016, burnt area was taken from GFED4. 2016 onwards, the updated GFED version MCD64A1 was used.
- We have used updated fossil fuel emissions products, with better seasonal cycles for fossil fuel burning emissions over Europe, the US, and Asia, and global totals for 2000-2017 from the Global Carbon Budget 2018.
- We have used a 1x1 degree zoom of the TM5 transport model over Europe and North America.
|
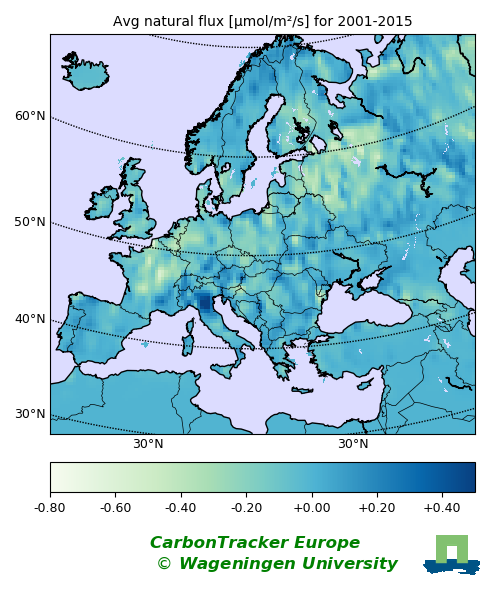
Figure 1: The long term mean biological uptake
|
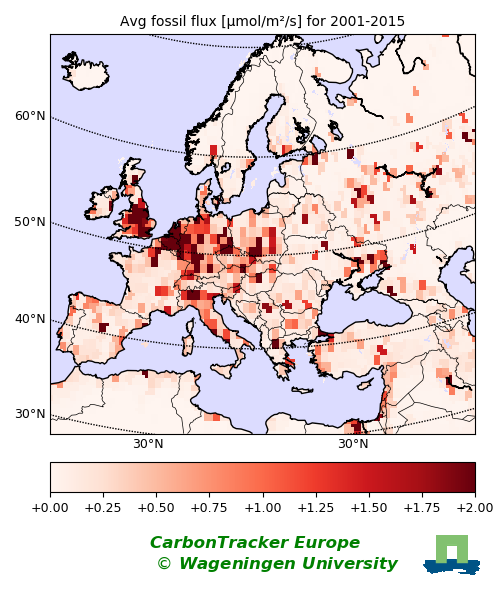
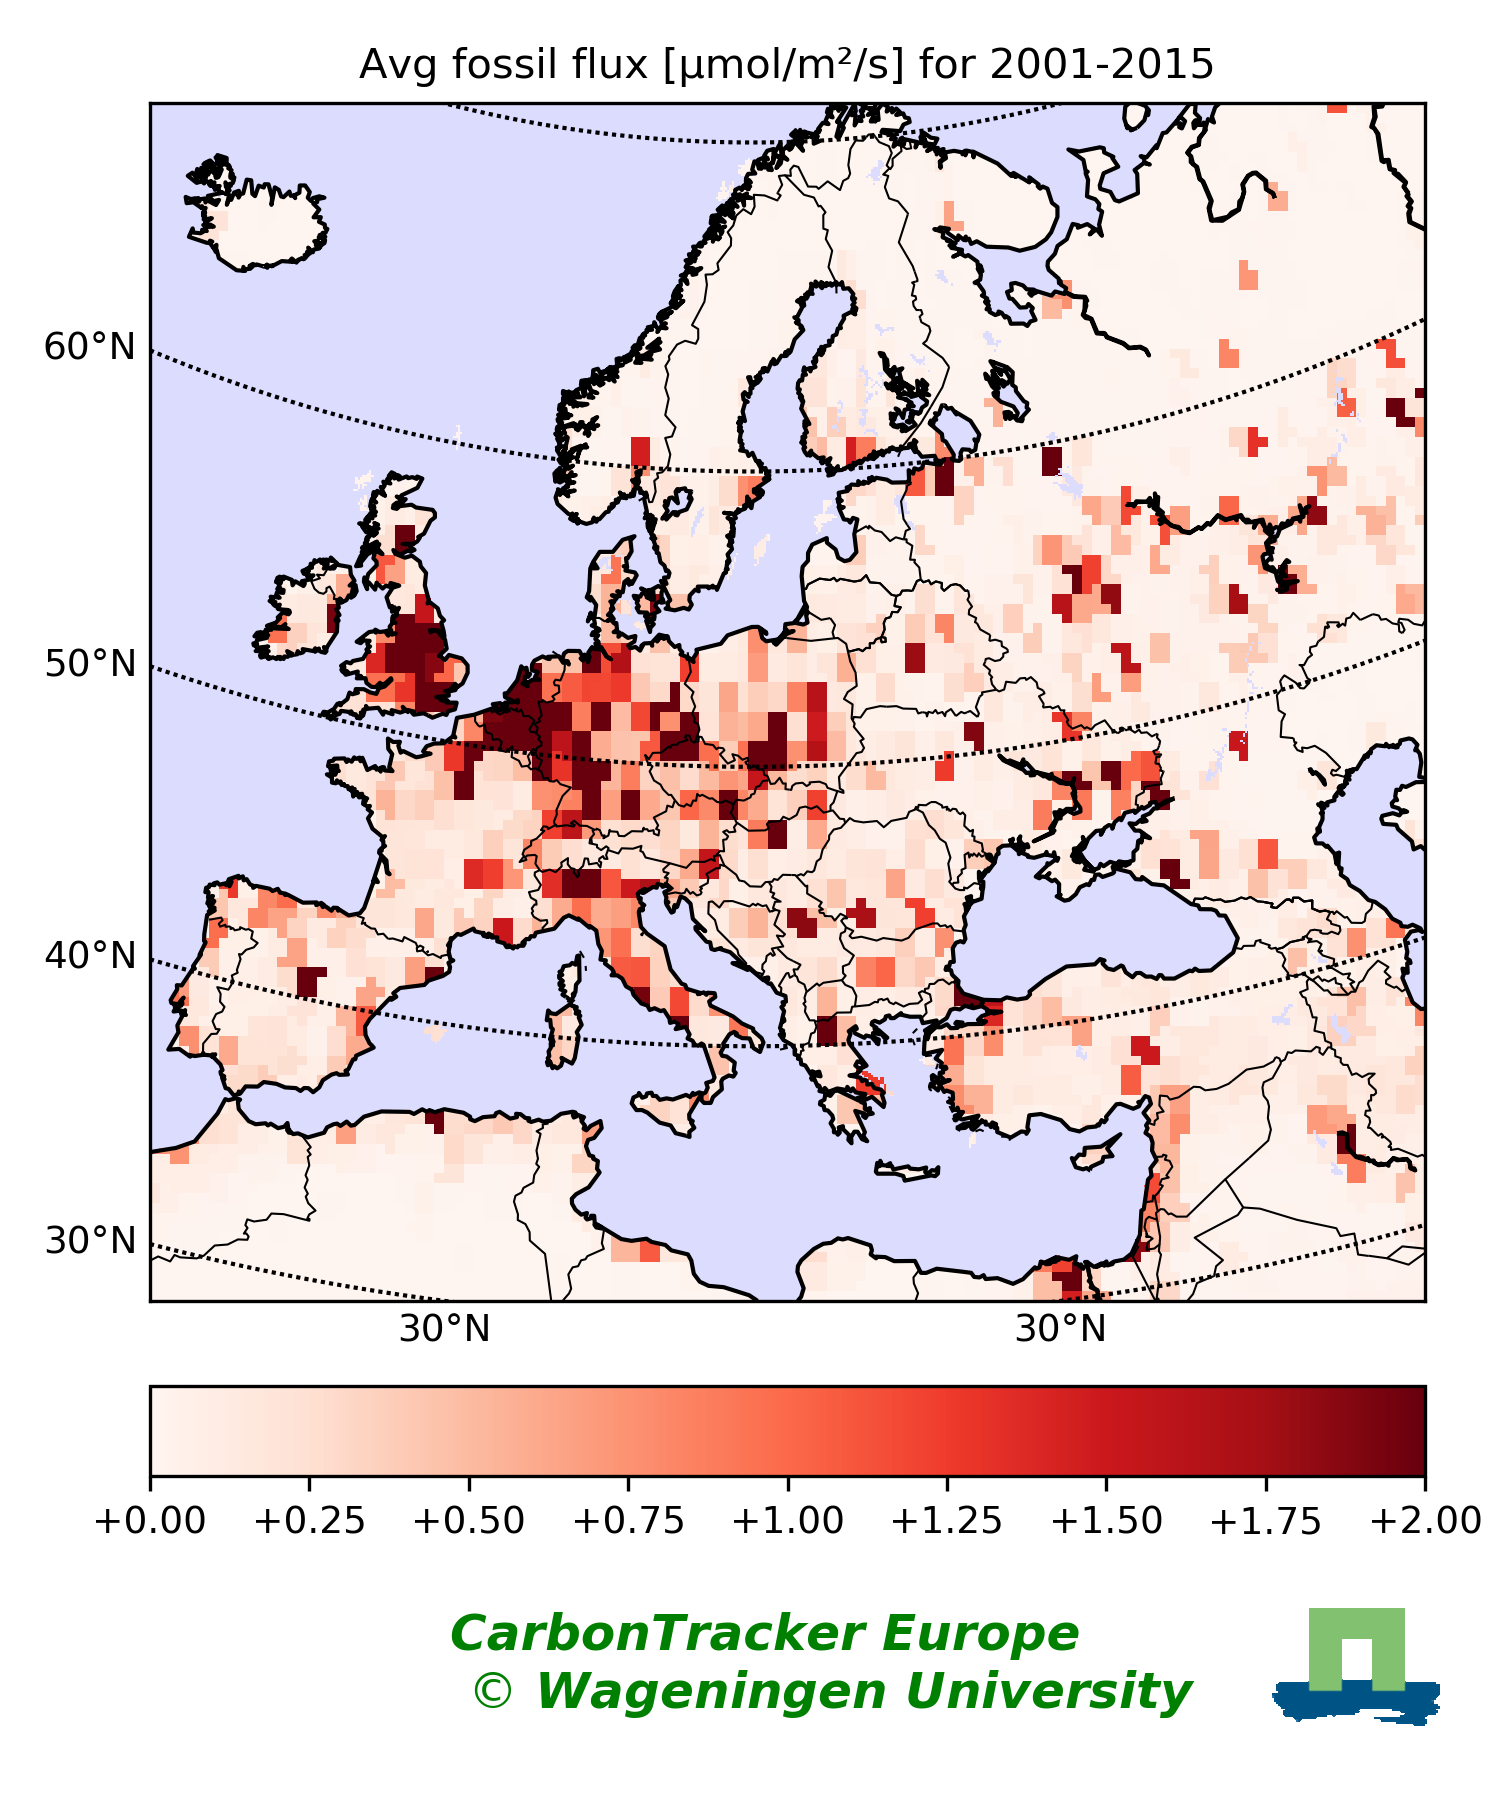
Figure 2: The long term mean fossil fuel emissons
|
|
|
Estimates of CO2 sources and sinks
From 2001 through 2017 ecosystems in Europe have been a net sink of -0.17 ± 0.44 PgC/yr (1 Petagram Carbon equals 1015 gC, or 1 billion metric ton C, or 3.67 billion metric ton CO2), offsetting about 11.5% of the emissions of 1.48 PgC/yr from the burning of fossil fuels in the EU27 countries and eastern European domain combined. The sources from fossil fuel combustion are mainly in the EU27 countries (+1.13 PgC/yr) while the uptake is predominantly in non-EU countries, and is found in the forested areas (-165 � 345 TgC/yr). Croplands appear as
a net source of carbon (21 � 269 TgC/yr) in our system, but the spatial overlap with
strong fossil fuel sources makes this estimate less robust than other
ecosystems. It is likely that most of cropland uptake is returned to the atmosphere after consumption of the goods produced, and are not part of a long-term net carbon sink. The same is true for other parts of the net sink: some processes can return carbon taken up over land back to the atmosphre outside the bounds of our monitoring capacity, such as for instance export of carbon by rivers.
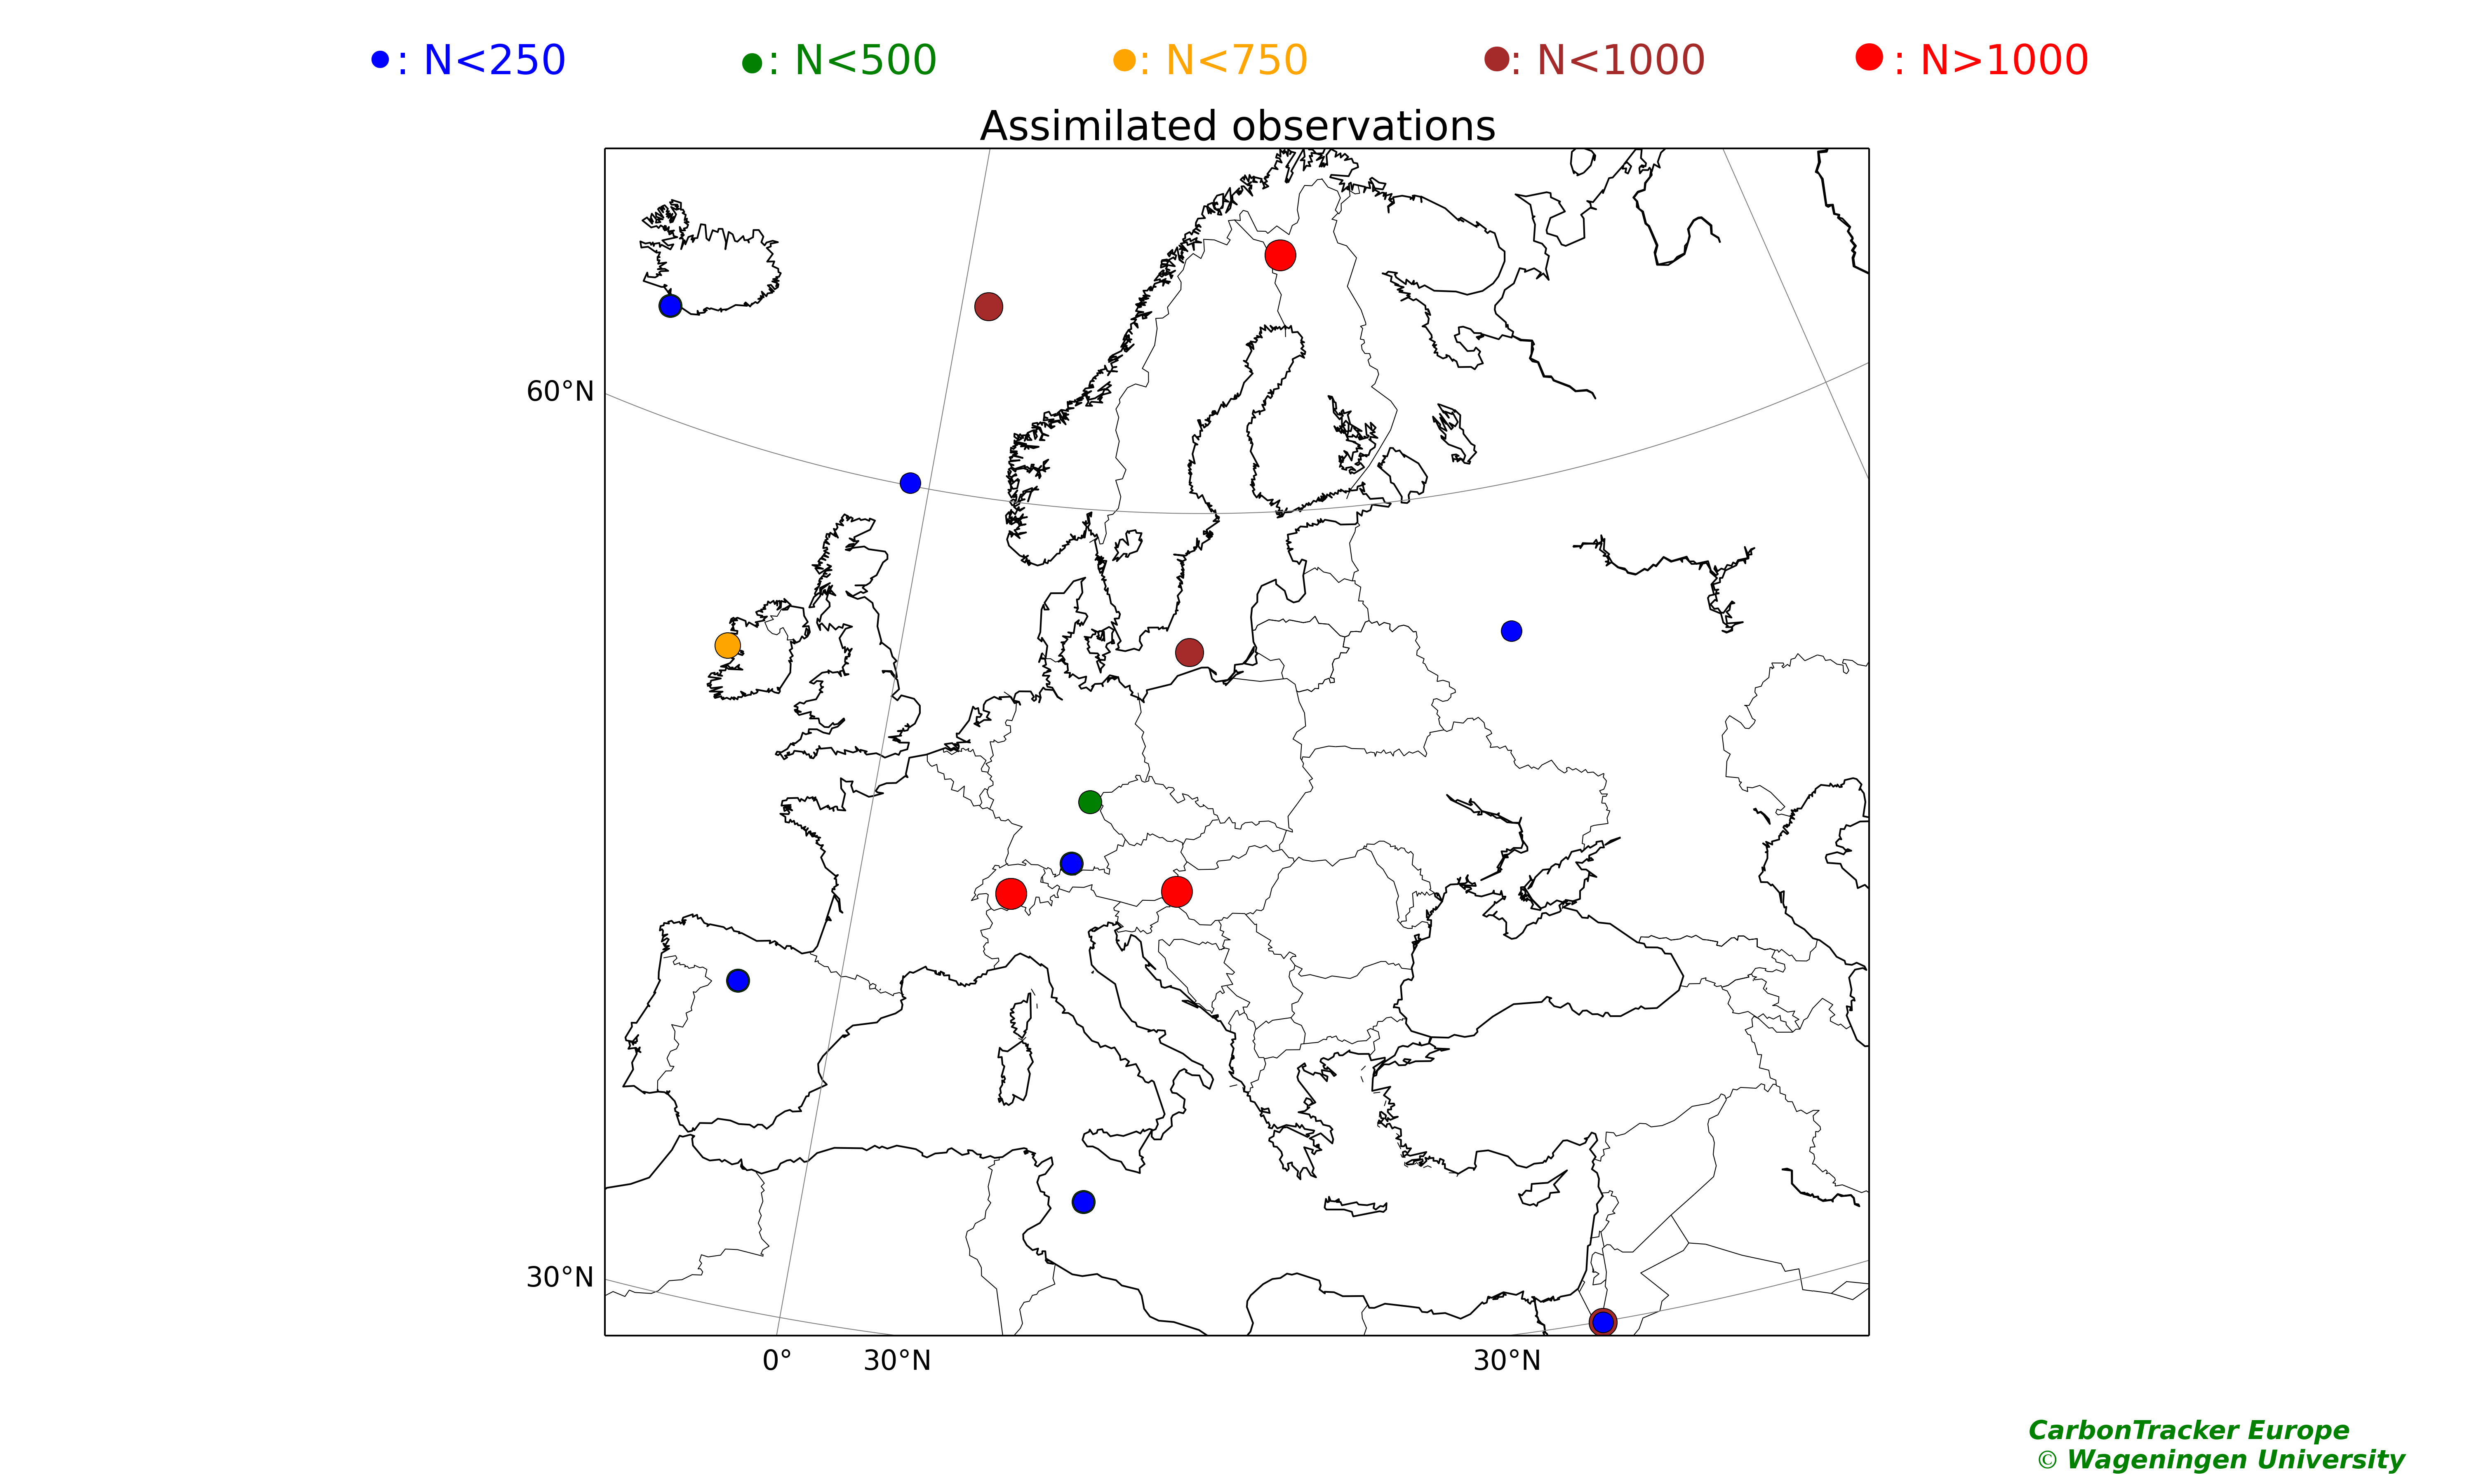
The CarbonTracker Europe results are constructed such that they are consistent with over 450,000 atmospheric CO2 observations from 96 sites.
|
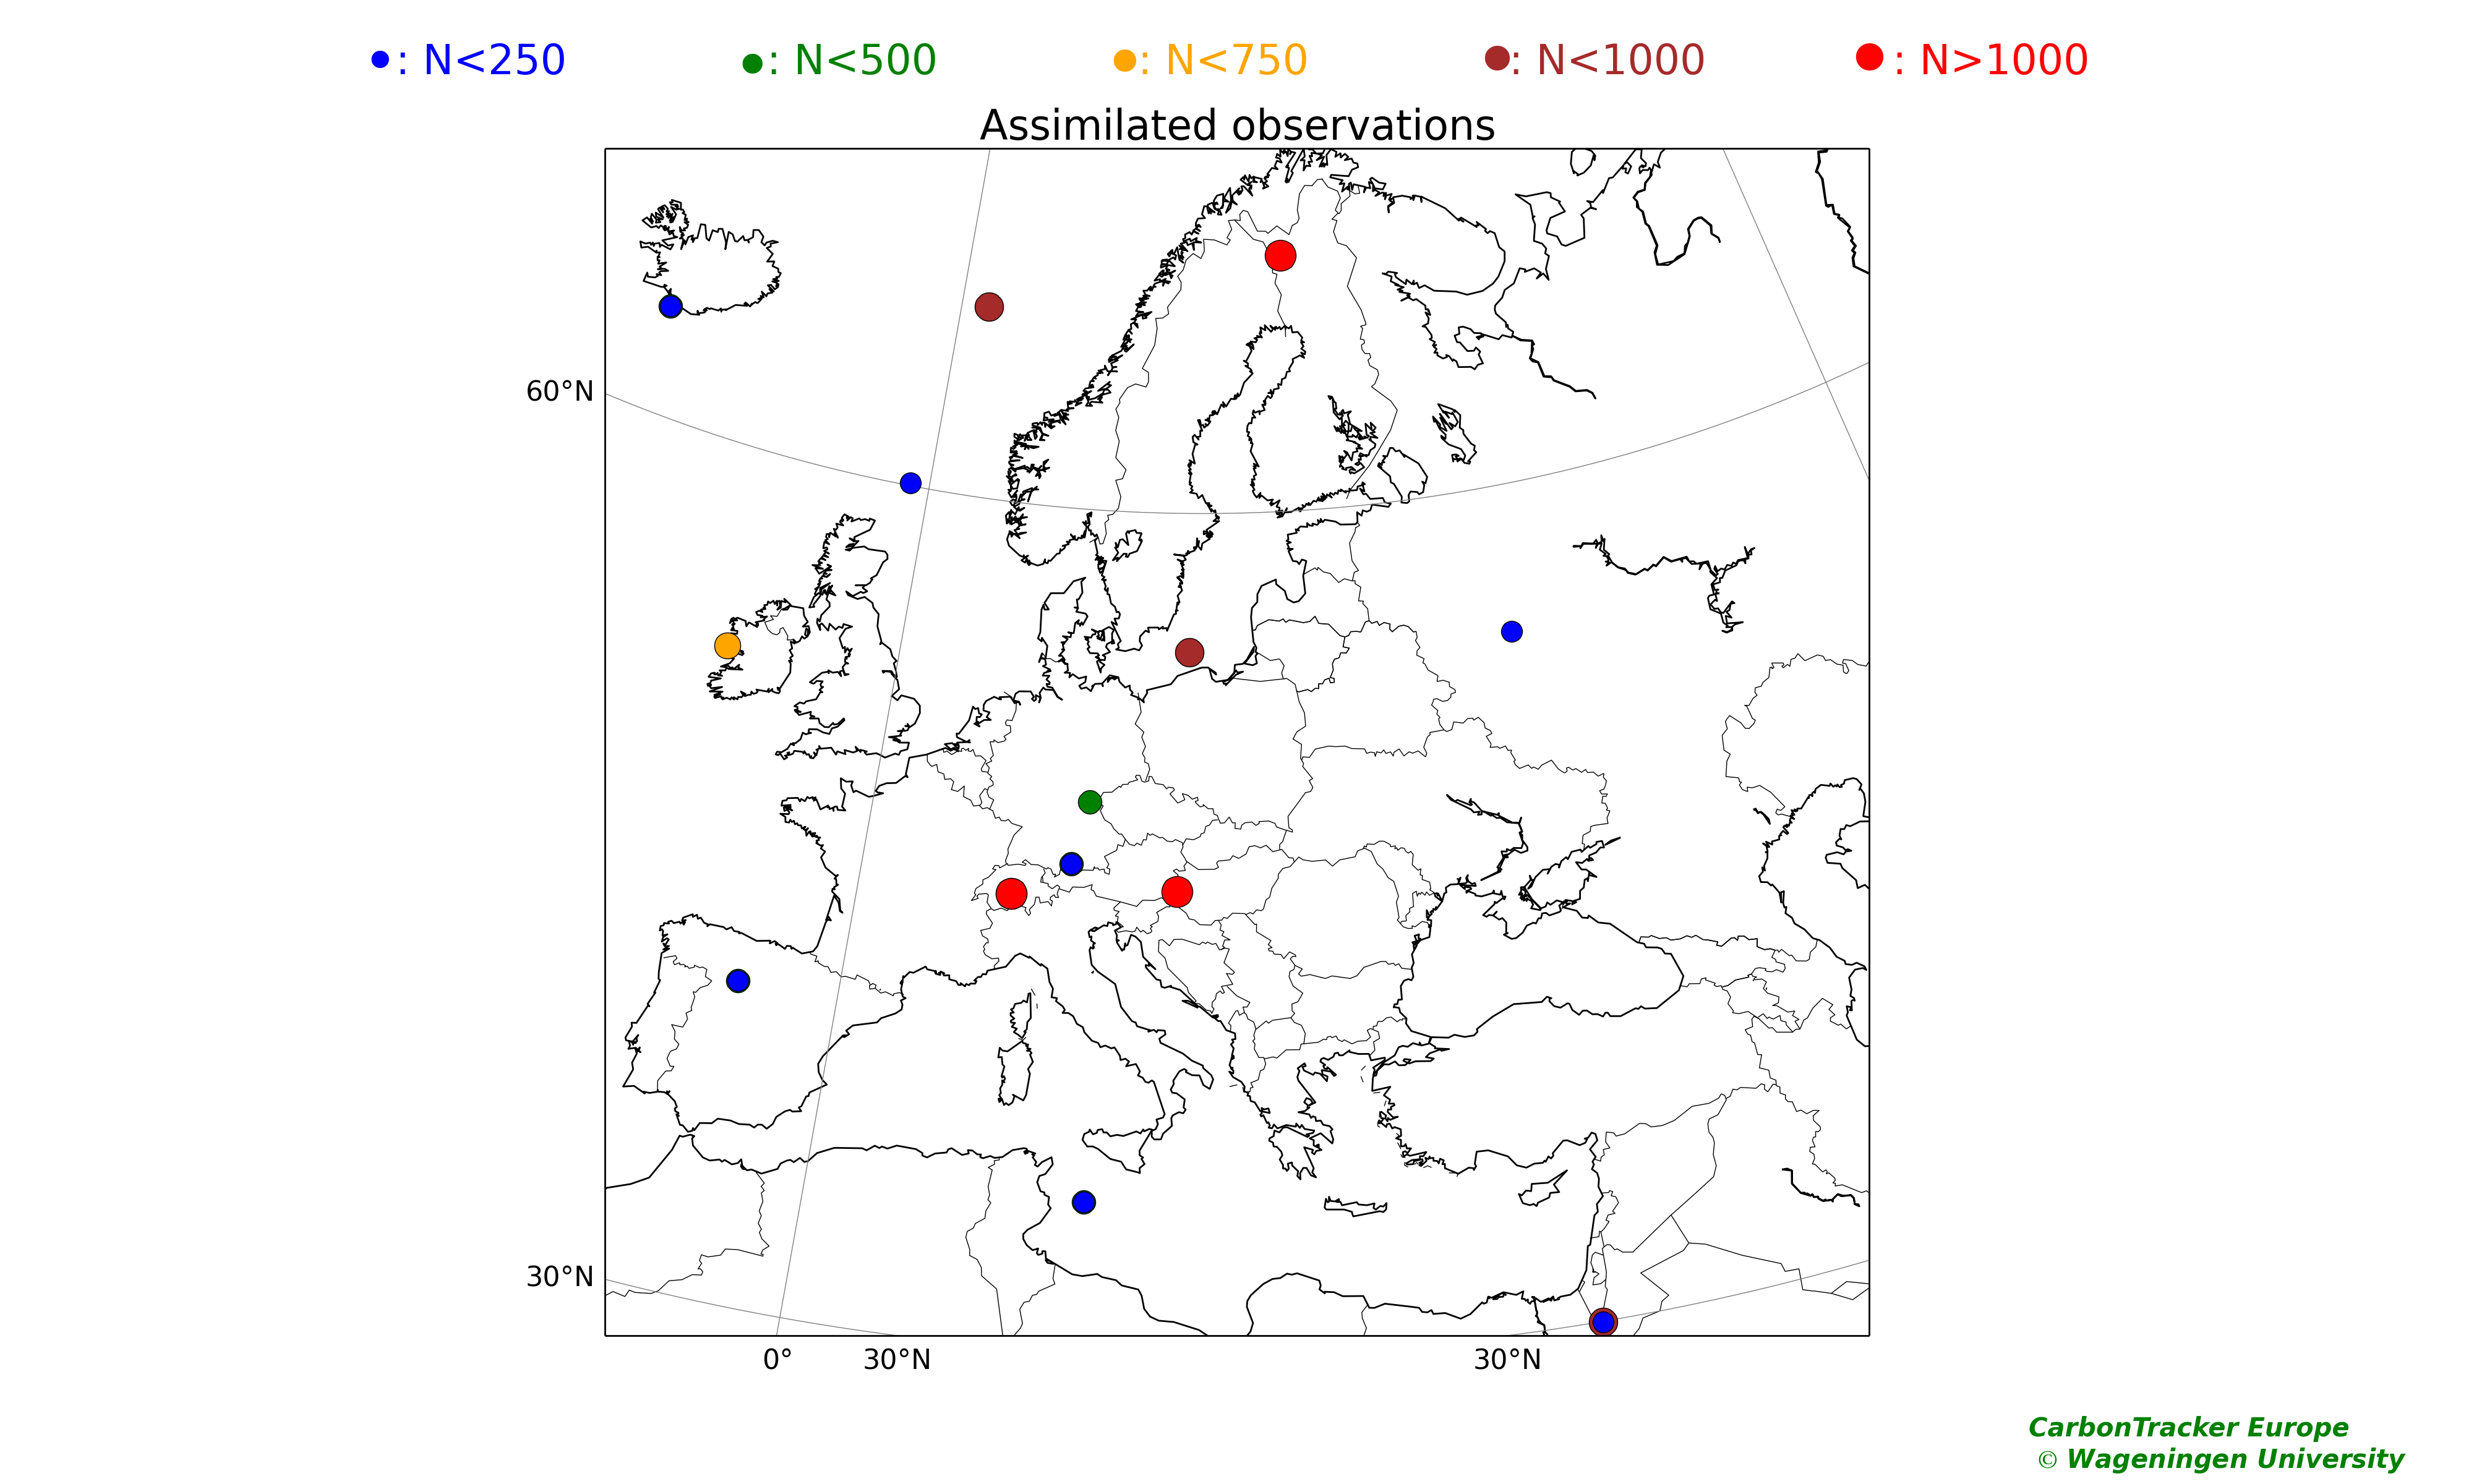
Figure 3: European sites from which data is used in CarbonTracker Europe
|
Word of caution about the biological flux maps
Figure 1 shows 1 x 1 degree detail for estimated fluxes. With the present observing network in Europe of about 20 sites the detailed 1 x 1 degree fluxes should not be interpreted as quantitatively meaningful for each block. To spread the influence of sparse observing sites we make the assumption that large ecosystem regions respond in similar ways (described by an exponential decay function) to variations of temperature and light. However, temperature and light are not uniform in an entire region, and thus the same response function does not produce a uniform flux over the region. Thus we caution that the spatial detail predicted by CarbonTracker within ecosystems has not been verified by observations.
|
Calculated time-dependent CO2 fields throughout the atmosphere
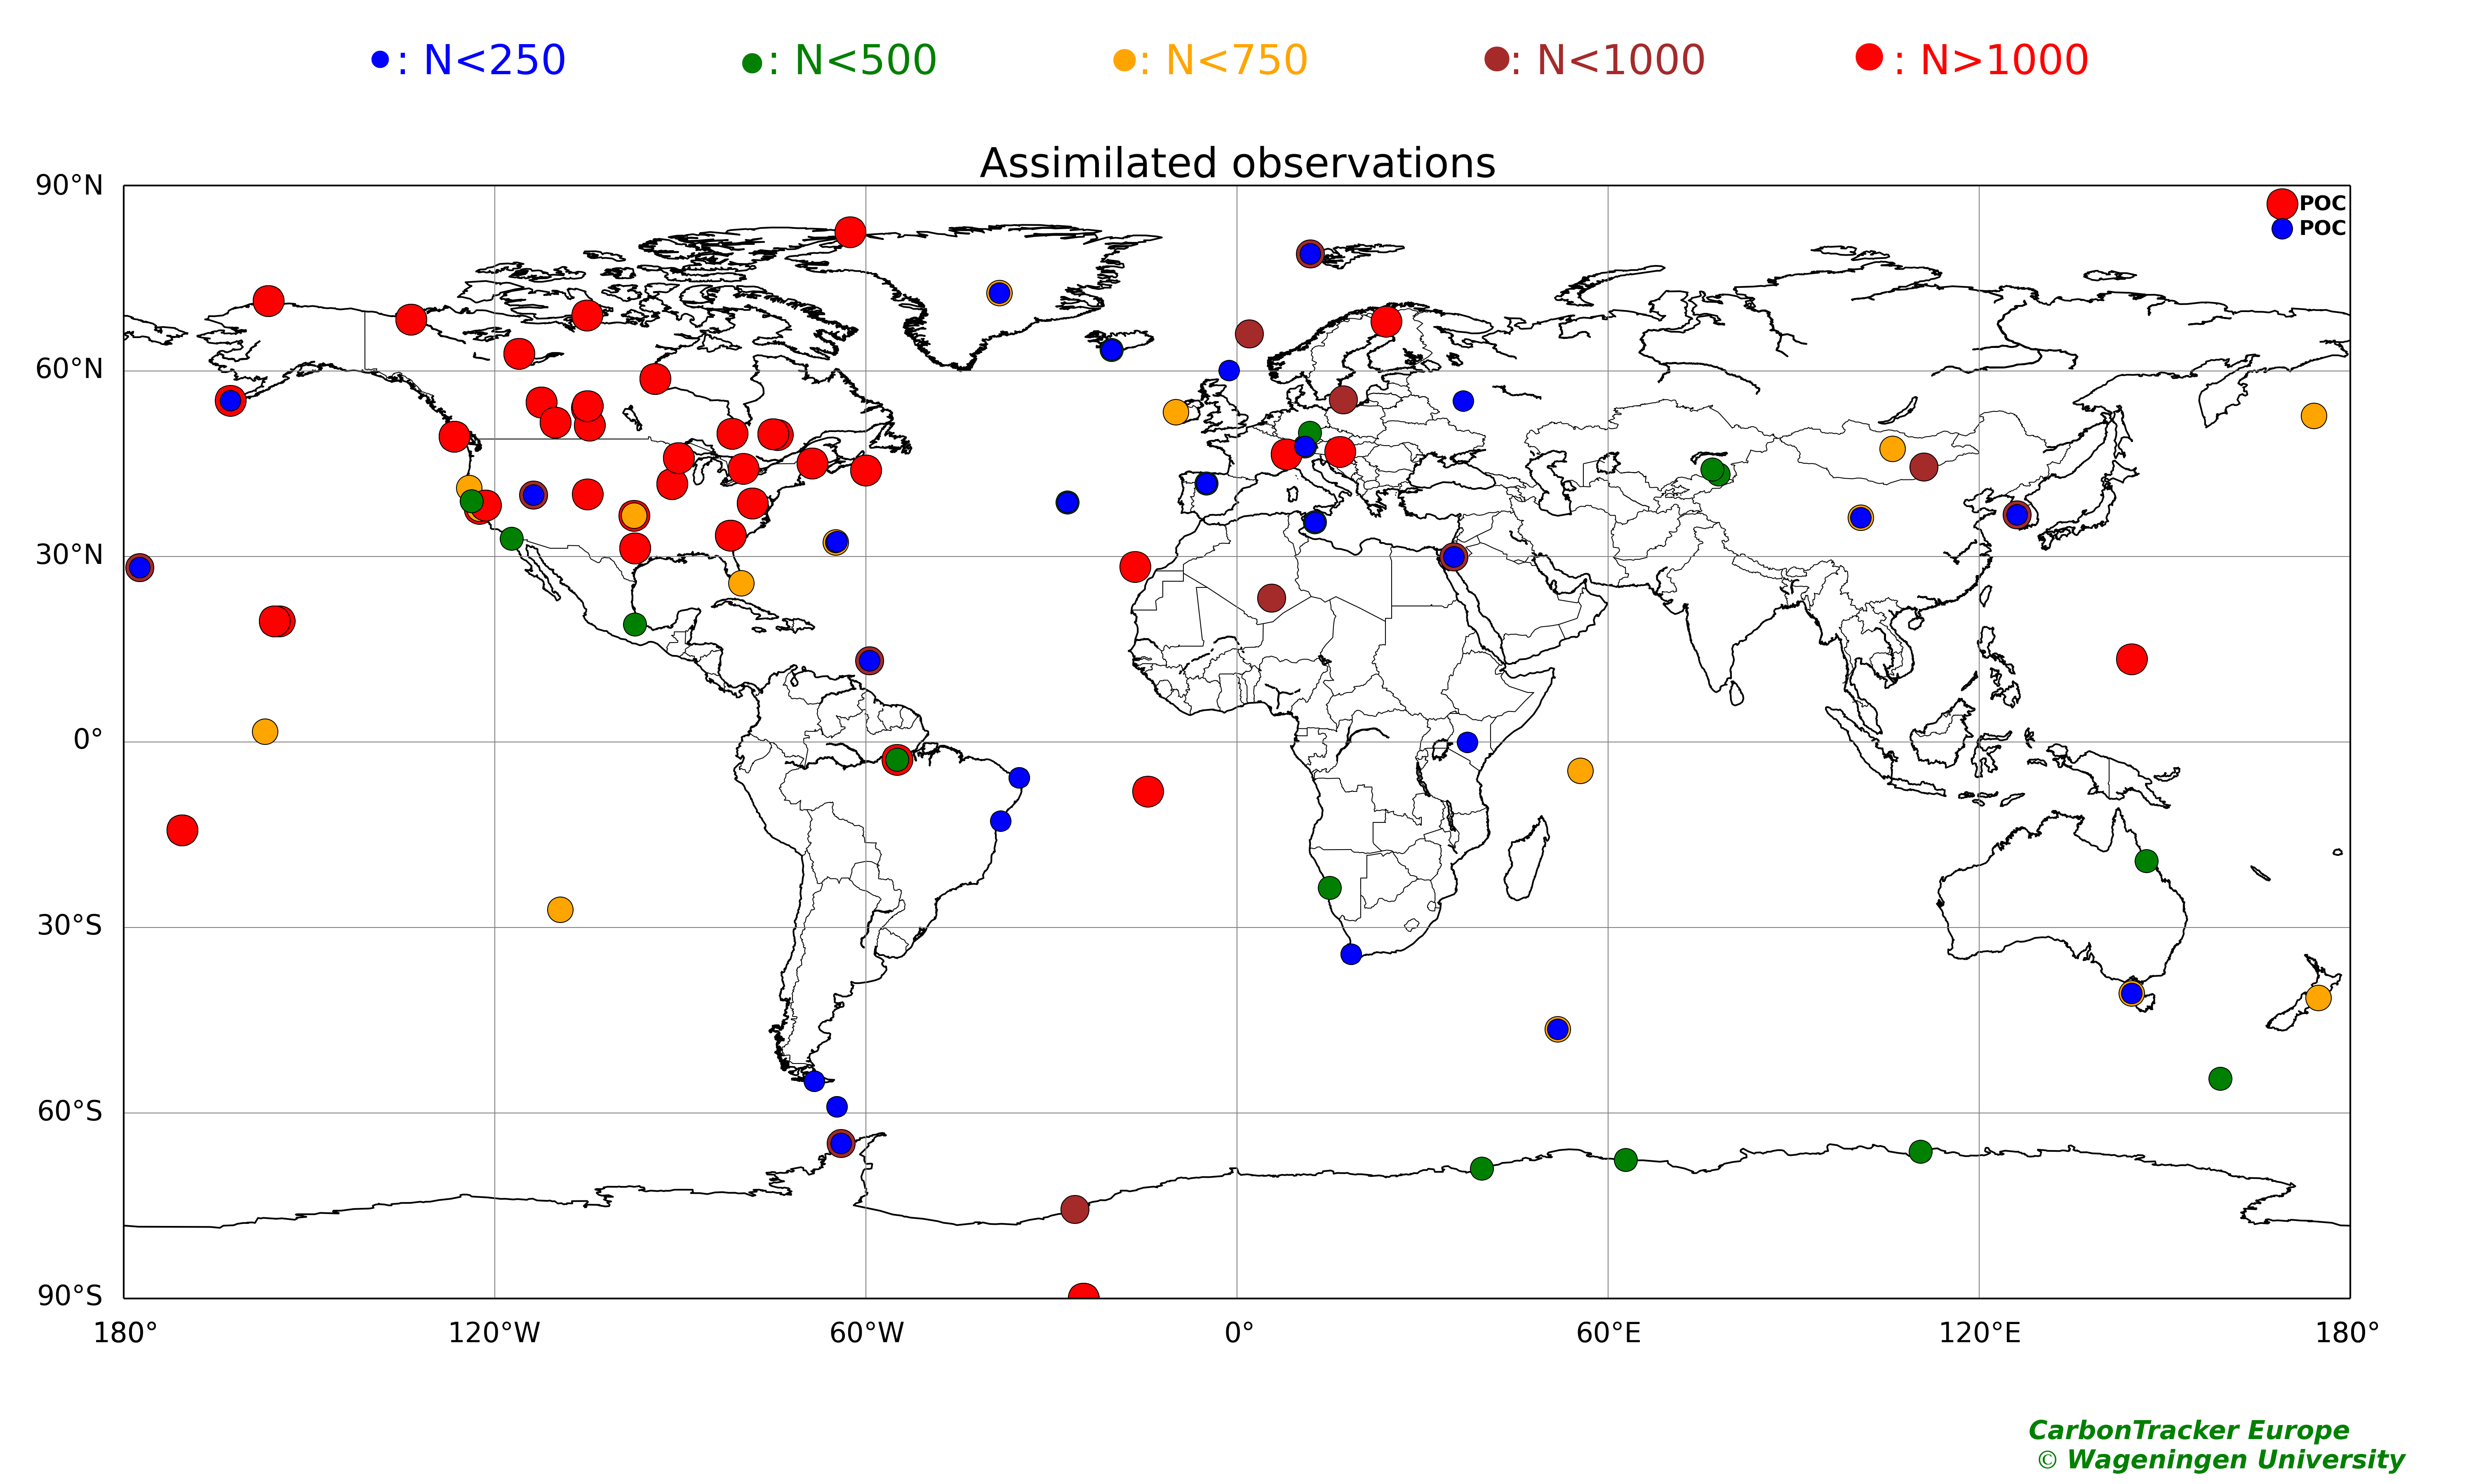
A "byproduct" of the data assimilation system, once sources and sinks have been estimated, is that the mole fraction of CO2 is calculated everywhere in the model domain and over the entire 2001-2017 time period, based on the optimized source/sink estimates. As a check on model transport properties, calculated CO2 mole fractions were compared with measurements of ~53,000 air samples taken by NOAA/ESRL at 26 aircraft sites and ~2.75 106 observations from the CONTRAIL program (NIES-MRI), as well as ~130,000 observations from the HIPPO I and II campaigns. These aircraft data had not been used in the estimation of sources/sinks (expect for 2 sites in regions with sparse observations).
|

Figure 4: All observation sites used in CarbonTracker Europe
|
Uncertainties
It is important to note that at this time the uncertainty estimates for the sources/sinks are themselves quite uncertain. They have been derived from the mathematics of the data assimilation system, which required several "educated guesses" for initial uncertainty estimates. The paper describing CarbonTracker (Peters et al. (2007), Proc. Nat. Acad. Sci. vol. 104, p. 18925-18930) and also that describing CarbonTracker Europe (Peters et al., 2009, Global Change Biology), present different uncertainty estimates, based on the sensitivity of the results to alternative yet plausible ways to construct the CarbonTracker system. For example, the 14 realizations used in the PNAS paper produce a range of estimates for net annual mean terrestrial uptake in North America from -0.40 to -1.01 PgC/yr, as given in the PNAS paper. The procedure is described in the Supporting Information Appendix to that paper, which is freely downloadable from the PNAS web site. In addition, the estimates do not take into account several additional factors noted below. The calculation was set up for sources/sinks to slowly revert, in the absence of observational data, to "first guesses" of close to zero net annual mean for ecosystems. This procedure may have produced a bias. Also due to the sparseness of measurements, we had to assume coherence of ecosystem processes over large distances, giving existing observations perhaps an undue amount of weight. The process model for terrestrial photosynthesis and respiration was very "basic", compared to recent releases of CarbonTracker Europe. Easily the largest single annual mean source of CO2 is emissions from fossil fuel burning, which are currently not estimated by CarbonTracker Europe. We use estimates from emissions inventories (economic accounting) and prescribe those to CarbonTracker Europe. A small relative error in the inventories would thus translate into a larger relative error in the annual mean ecosystem sources/sinks that have smaller magnitudes. We expect to add a process model of fossil fuel combustion in future releases of CarbonTracker Europe. Finally, additional measurement sites are expected to lead to the greatest improvements, especially to more credible and specific source/sink results at smaller spatial scales and in regions with scarse observations available, especially the tropics.
Overview tables
The tables below show our average flux extimates for the period 2001-2017. Table 1 shows the natural (= biosphere, ocean and fires) fluxes for the transcom regions, table 2 shows the natural fluxes for the extended transcom regions and table 3 shows the fossil fuel emissions.
|
|
CarbonTracker Europe is a Wageningen University contribution
to the Integrated Carbon Observing System (ICOS)
|
|